| Page 1 out of 30 Pages |
Which baseline is used to identify a Zombie VM?
A. VM is powered off for the past 21 days.
B. Memory usage is less than 1% and memory swap rate is equal to 0 Kbps for the past 21 days.
C. VM has no logins for the past 21 days
D. Fewer than 30 1/Os and less than 1000 bytes per day of network traffic for the past 21 days
Explanation: The correct answer is D. Fewer than 30 I/Os and less than 1000 bytes per
day of network traffic for the past 21 days.
A zombie VM is a type of inactive VM that is powered on but does very little activity. A
zombie VM wastes host resources such as CPU, memory, disk, and network that could be
used by other VMs. A zombie VM can be identified by using the VM Profile feature in Prism
Central. The VM Profile feature analyzes the resource utilization of each VM and assigns it
a profile based on its efficiency and impact on other VMs. The profiles are as follows1:
Refer to exhibit: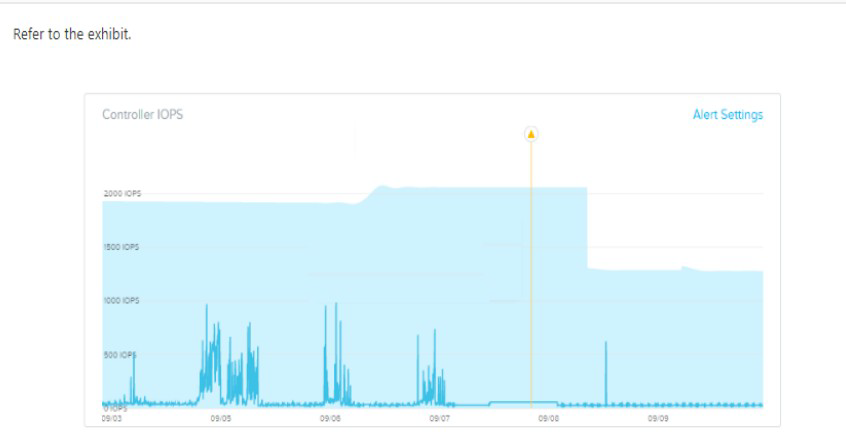
Why has an anomaly been triggered?
A. Controller reached 2500 IOPS.
B. Observed IOPS exceed normal values.
C. Normal Controller behavior has increased.
D. Observed values do not match predicted values
Refer to Exhibit: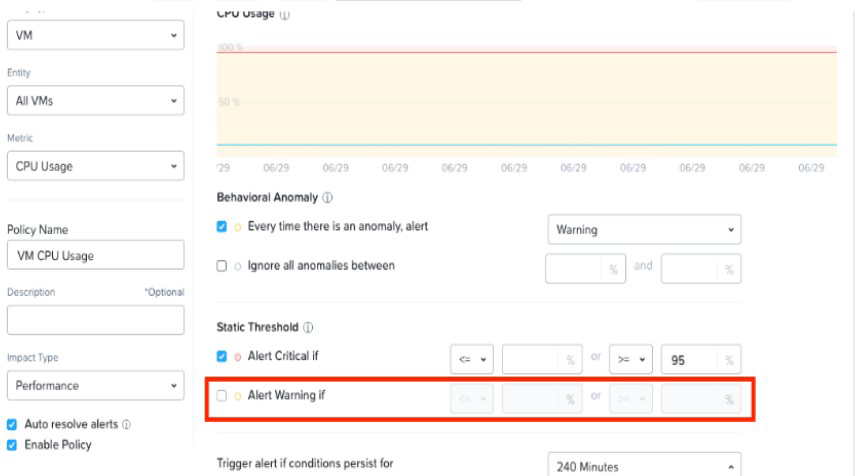
An administrator is trying to create a custom alert policy for all VMs.
Why is the Alert warning if field greyed cut?
A. The Alert critical if threshold is set.
B. The Behavioral Anomaly threshold is set.
C. The Enable Policy option checked.
D. The Auto resolve alerts option is checked.
Explanation: when you create a custom alert policy, you can choose between two types of thresholds: Static Threshold and Behavioral Anomaly. Static Threshold allows you to set a fixed value for the metric that triggers the alert. Behavioral Anomaly allows you to use machine learning to detect abnormal behavior based on historical data. If you select Behavioral Anomaly as the threshold type, you cannot set a warning level for the alert. You can only set a critical level that indicates how much deviation from normal behavior is considered an anomaly3. Therefore, the Alert warning if field is greyed out when you select Behavioral Anomaly.
Refer to Exhibit: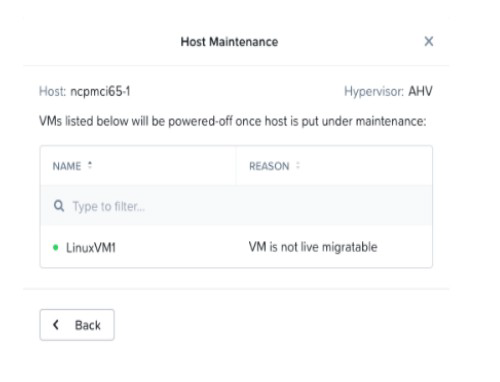
An administrator is trying to put a node into maintenance mode but receives the message
shown in the exhibit.
What is a potential reason for this dialog?
A. LinuxVM1 uses a vDisks stored in a RF1 Datastore
B. LinuxVM1 uses a Volume Group
C. LinuxVM1 uses a virtual GPU
D. LinuxVM1 uses e vDisks stored in a RF3 Datastore
Explanation: According to the Nutanix Community1, host maintenance mode is used to
safely migrate all the user virtual machines (VMs) in the host and make sure no VMs are
running on the node. If a VM can’t be migrated to another host, you need to shut down the
VM for the host to enter into maintenance mode.
According to The Virtualist2, a storage container is a logical segmentation of a storage pool
that can be mounted as an NFS datastore on ESXi hosts. You can choose a replication
factor (RF) for each storage container, which determines how many copies of data are
stored across different nodes.
What is a requirement to enable Flow Networking
A. A dedicated virtual switch has been created for Flow Networking.
B. Flow Micro segmentation must be enabled.
C. Microservices infrastructure must be enabled.
D. Prims Central is using a three-node scale-out deployment
Explanation: Flow Networking is a feature that enables software-defined networking for AHV clusters. It allows users to create and manage virtual private clouds (VPCs), subnets, and network services such as NAT, DHCP, routing, and VPN. Flow Networking also supports service insertion and chaining, which enables integration with third-party network functions such as firewalls and load balancers. Flow Networking is built on top of the microservices infrastructure (MSP) in Prism Central, which provides the platform for running various Nutanix services such as Calm, Karbon, and Objects. Therefore, to enable Flow Networking, the MSP must be enabled first on Prism Central1. The MSP can be enabled from the Prism Central settings page or from the command line interface (CLI) of the Prism Central VM2. Enabling the MSP will also enable Flow Microsegmentation, which is another feature that provides network security and visibility for AHV clusters.
Refer to Exhibit.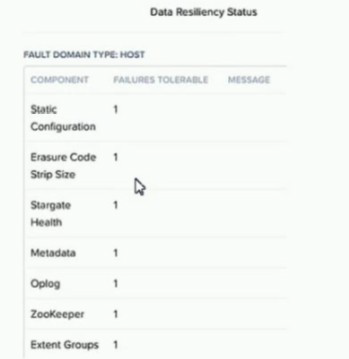
An administrator increases the cluster RF to 3. The containers are not modified.
What will the new values in the data resiliency dashboard be for FAILURES TOLERABLE
for the Zookeeper and Extent Groups components?
A. Zookeeper = 1 and Extent Groups = 1
B. Zookeeper = 2 and Extent Groups = 2
C. Zookeeper = 2 and Extent Groups = 1
D. Zookeeper = 1 and Extent Groups = 2
Explanation: According to the web search results, the cluster redundancy factor (RF)
determines how many copies of the cluster metadata and configuration data are stored on
different nodes. By default, the cluster RF is 2, which means that there are three copies of
the Zookeeper and Cassandra data on the cluster. If the cluster RF is increased to 3, then
there will be five copies of the Zookeeper and Cassandra data on the cluster12. This
means that the Zookeeper component can tolerate two failures, as it can still operate with a
quorum of three nodes out of five3.
However, the container replication factor (RF) determines how many copies of the VM data
and oplog are stored on different nodes. The container RF can be set independently for
each container, and it can be different from the cluster RF. For example, a container can have RF 2 even if the cluster has RF 34. In this case, the container will only have two
copies of the VM data and oplog on the cluster, regardless of the cluster RF. This means
that the Extent Groups component can only tolerate one failure, as it needs at least one
copy of the VM data and oplog to be available5.
Therefore, if the administrator increases the cluster RF to 3, but does not modify the
containers, then the new values in the data resiliency dashboard will be Zookeeper = 2 and
Extent Groups = 1
| Page 1 out of 30 Pages |
Contact Us - Privacy Policy - Refund Policy - Terms ... Copyright © - All Rights Reserved